
With new mortgage regulations due to
be implemented in less than a month, the Consumer Financial Protection Bureau (CFPB)
has released a set of materials designed to educate both homebuyers and
homeowners about the new regulations and how they can be used to protect
homeowners and ease the home buying process.
CFPB also released a manual summarizing the new regulations and designed
to be used by housing counselors.
The materials, all available on the Bureau's website, explain what a Qualified Mortgage is, why the category was designed, what it does for consumers, and how to find one in the mortgage market. Consumer rights under new rules effecting mortgage servicers are also explained, as are ways to gather information about an existing loan and to get help if the rules are violated.
The materials are in several formats:
Factsheets: There is a two-page factsheet with an overview of all of the new consumer protections in the Bureau's mortgage rules. It explains what a WM mortgage is and why it protects the borrower including an explanation of its protections against steering and high fees. It also lays out the consumer protections afforded borrowers under new servicing rules and explains how to file a complaint with CFPB for any violations of the rules. A second factsheet is a summary of the new procedures to facilitate borrower's access to foreclosure avoidance options.
Tips: There are separate tip sheets homebuyers looking for a mortgage, for homeowners on how to get the most out of their mortgage, and one for troubled homeowners facing foreclosure.
Tools: CFPB also has added questions and answers about the regulations to its interactive AskCFPB website tool and reminds consumers that its website also offers tools to find local housing counseling agencies to answer their questions or address their concerns. Consumers that have an issue with consumer financial products or services, such as a mortgage, can also submit a complaint on the site.
"Taking on a mortgage may be the largest financial obligation of a consumer's lifetime," said CFPB Director Richard Cordray. "We want to make sure that potential homebuyers have the information they need to make responsible decisions and that current borrowers know about their new protections."
The Bureau says it is working with industry, housing counselors, and consumer groups to promote a smooth implementation of the new rules. Most of the rules, including the new Qualified Mortgage regulation, go into effect on January 14.

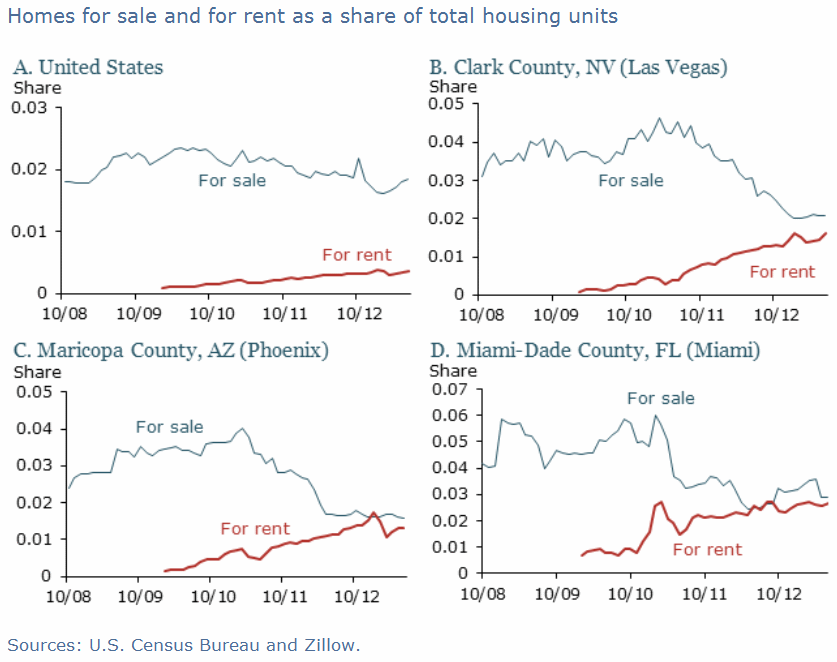
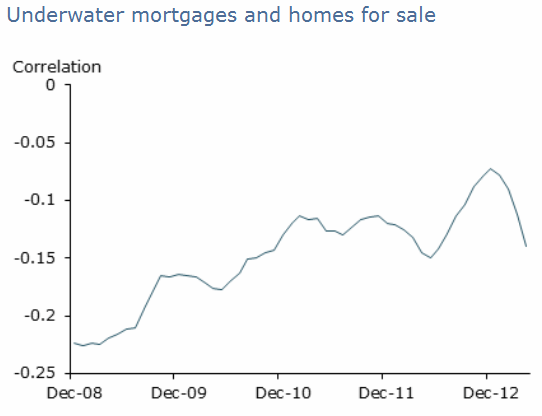
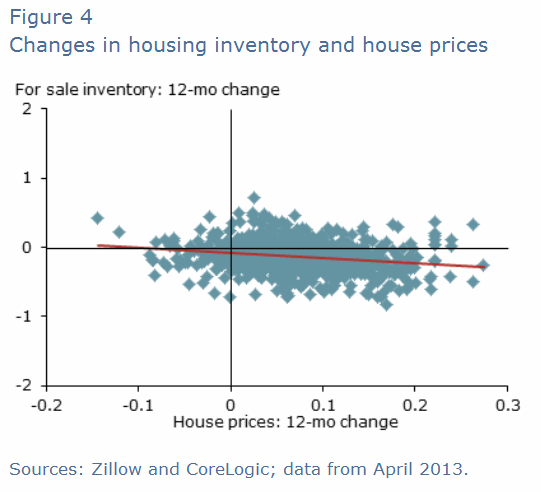
 Daren Blomquist, Vice President of Realty Trac said that the steadily rising home prices are lifting all boats in this housing market and should spill over into more inventory of home for sale in the coming months. " Home owners who already have ample equity are quickly building on that equity, while the 8.3 million homeowners on the fence with little or no equity are on track to regain enough equity to sell before 2015 if home prices continue to increase at the rate of 1.33 percent per month that they have since bottoming out in March 2012."


